I created my first Shopify theme, Coffee World. I used this project to learn web performance, apply what I learned, and document the process.
In this article, I’ll walk you through practical examples to improve your Shopify store’s performance.
We’ll do it by improving a very important part of your website: the most visible and resource-demanding visual element during load - your LCP.
Table of contents
- Step 1: Understanding LCP
- Step 2: Reducing Load Delay
- Step 3: Reducing Render Delay
- Step 4: Reducing Server-Side Render Delay
- Step 5: High-level summary
- Step 6: Recommended resources
Step 1: Understanding LCP
1.1: Why web performance is important
Web performance measures a website’s speed, stability, and reliability. Better performance numbers create a smoother browsing experience and have two major impacts:
- Better user experience resulting in more conversions, fewer bounces and happier customers
- Better performance resulting in better SEO and better discoverability. On the other hand, bad web performance numbers might cause your visitors headaches and frustrations. If your website is slow in ideal conditions - browsing with a fast internet connection on a powerful laptop -, imagine what happens in bad conditions - with slow internet on a slow device.
Good web performance helps both users and algorithms; search engines rank fast websites better than slow ones.
The good news is that measuring performance is easy. Free tools can tell us, with good precision, what to improve.
1.2: What is LCP?
LCP is part of the Core Web Vitals, a set of key web performance metrics defined by Google.
Chrome has built-in tools to measure Core Web Vitals, and many platforms (including Shopify) use them to evaluate your website.
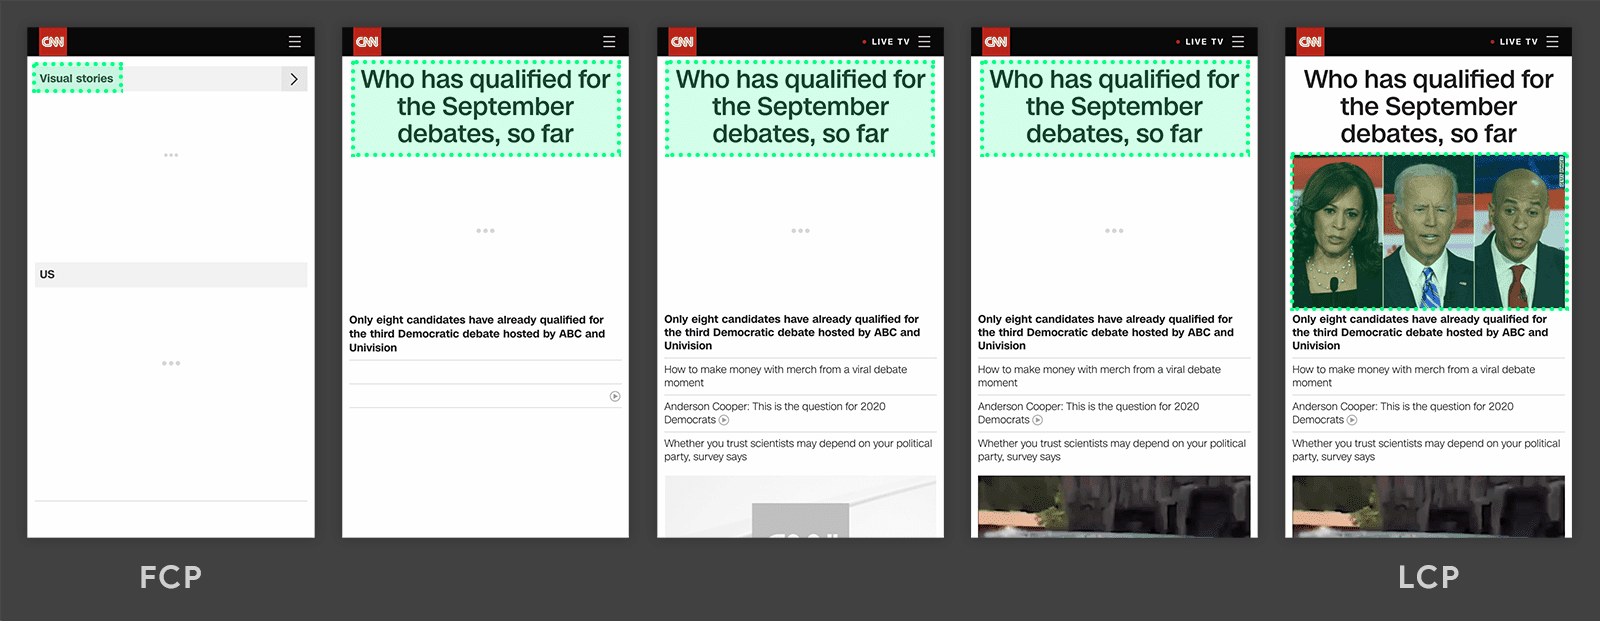
LCP is the largest visible content element (image or text block) in the viewport rendered during page load.
Usually it’s an image: either the feature image of a blog post or a hero image. Because it’s visually prominent, optimizing it improves UX dramatically.
1.3: How to evaluate LCP?
We measure LCP by time: faster is better. Here are Google’s evaluation ranges:
LCP scoring on mobile
| LCP time (in seconds) | Color-coding |
|---|---|
| 0-2.5 | 🟢 Fast |
| 2.5-4 | 🟠 Moderate |
| Over 4 | 🔴 Slow |
LCP scoring on desktop
| LCP time (in seconds) | Color-coding |
|---|---|
| 0-1.2 | 🟢 Fast |
| 1.2-2.4 | 🟠 Moderate |
| Over 2.4 | 🔴 Slow |
Remember: Mobile users often experience much slower load/render times, so prioritize testing on mobile throttled conditions first.
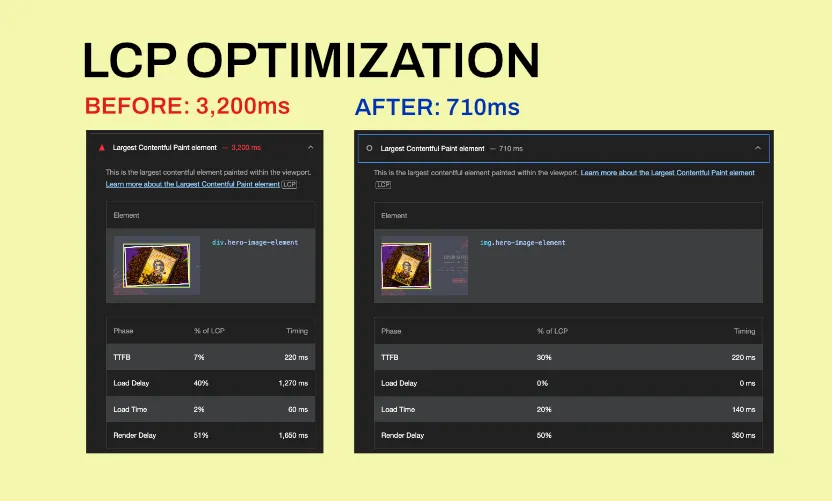
1.4: LCP subparts
LCP has 4 subparts (phases) that happen in sequence. Identifying which subpart takes too long helps us decide what to improve.
| LCP subpart | Description | Optimal % of LCP |
|---|---|---|
| Time to first byte (TTFB) | The time from when the user initiates loading the page until the browser receives the first byte of the HTML document response. | ~40% |
| Resource Load Time delay (or simply “load delay”) | The time between TTFB and when the browser starts loading the LCP resource. | <10% |
| Resource Load time | The duration of time it takes to load the LCP resource itself. | ~40% |
| Element Render Time Delay (or simply “render delay”) | The time between when the LCP resource finishes loading and until the LCP element is fully rendered | <10% |
Google suggests first improving Resource Load Time Delay (Load Delay) and Element Render Time Delay (Render Delay). We have the most frontend control over these (e.g.: in a Shopify theme), and lab data shows this is where most websites lose time.
1.5: Performance improvement strategy
Let’s define what we want to achieve:
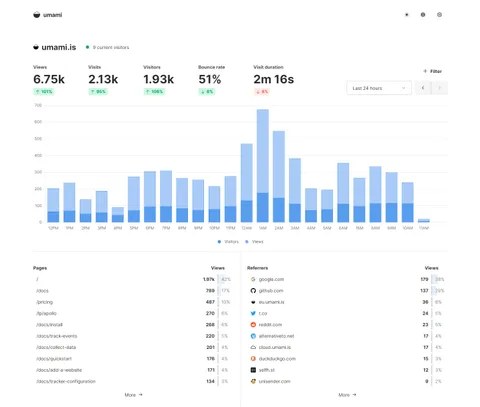
- Our end goal: get good LCP numbers for our production website using Google PageSpeed. PageSpeed is a free, publicly available performance audit tool.
- Our intermediate goal: get good LCP numbers on
localhostusing Lighthouse. Lighthouse is a performance audit tool built into Chrome, giving us high-level insights about performance. - Our first goal: get good LCP numbers on localhost using Chrome Dev Tools Performance tab. Performance tab is a low-level performance audit tool, giving us all the nitty-gritty details to debug and improve.
This step-by-step approach helps us solve issues locally with fast iterations, then validate the solution in production.
1.6: Technical tips before you begin
One last section before we dive in with some technical tips:
- Use a separate browser without accounts and plugins, like Chrome Dev so your personal customizations won’t affect performance measuring.
- Toggle throttling when using Performance tab, so your results will have a closer match to Lighthouse results:
- CPU: 4x slowdown - recommended
- Network: Slow 4G
- Run tests for both mobile and desktop views 🙂
- Identify repaints and render bottlenecks when browsing the performance flamechart:
Chrome Devtools > Render, check “Paint flashing” and “Layout Shift Regions” Now that we’re prepared, let’s dive into the improvements. Here’s how to improve LCP.
Step 2: Reducing Load Delay
The goal of improving load delay is to make sure the LCP resource starts loading as early as possible. We can achieve this by eliminating or deprioritizing unnecessary resource loads. Usually there are two reasons LCP starts late:
- Prioritization: Higher priority assets get loaded first
- Discoverability: Something blocks the load (e.g.: script) and/or the LCP is not yet discovered by the browser.
2.1: Solving prioritization issue
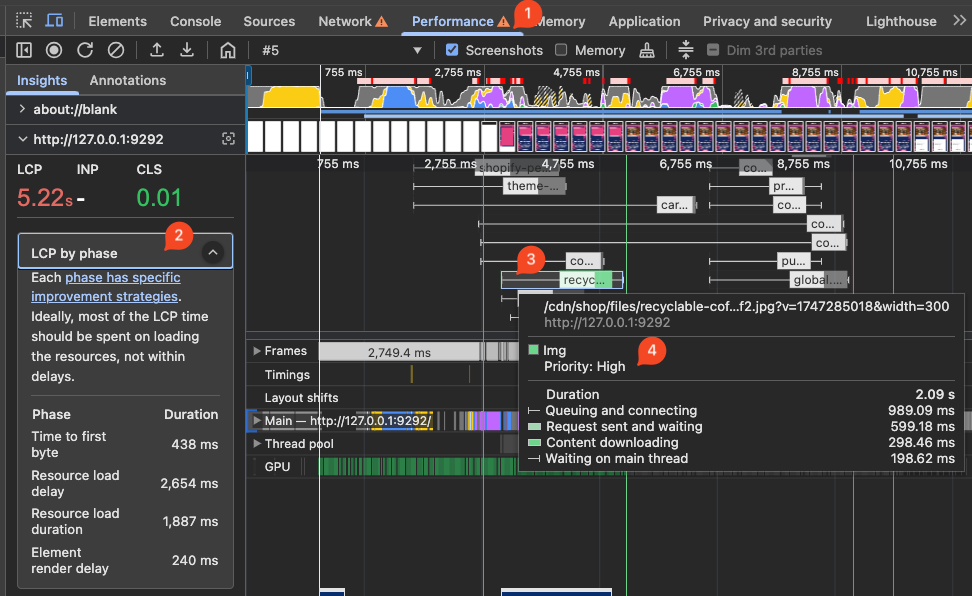
To see the priority of your LCP resource go to Performance tab, click on LCP by phase to highlight your LCP element in the waterfall chart (light blue stroke). Hover with your mouse to see its priority.
To increase the priority of a resource we can use the rel and fetchpriority attributes.
<link fetchpriority="high" rel="preload" href="/images/large/london.jpg" as="image">Use rel and fetchpriority to control resource load priority
LCP mismatch
You might load multiple image versions at different sizes. This is common in Shopify. If LCP by phase highlights a larger-than-expected version, your LCP numbers will usually be worse.
If that’s the case, make sure you are loading only the right version of your image. To achieve that you can use the picture HTML element.
<picture>
  <source media="(min-width:650px)" srcset="img_pink_flowers.jpg">
  <source media="(min-width:465px)" srcset="img_white_flower.jpg">
  <img src="img_orange_flowers.jpg" alt="Flowers" style="width:auto;">
</picture>
The picture HTML element can be used to serve different versions of your image
Learn more: https://www.w3schools.com/tags/tag_picture.asp
Resource priority order
Browsers use the rel and fetchpriority attributes to evaluate priority, and set up the following priority order:
| Element | Priority |
|---|---|
element without rel="preload" | ⚪ Lowest (no priority) |
element with <link rel="preload" fetchpriority="low"> | 🔵 Low |
element with <link rel="preload"> | 🟡 Medium |
element with <link rel="preload" fetchpriority="high"> | 🔴 High |
If our resource delay score is still low despite adding these necessary attributes to our LCP image, and removing them from other elements that might compete for prioritization, we might have a discoverability issue.
2.2: Solving discoverability issue
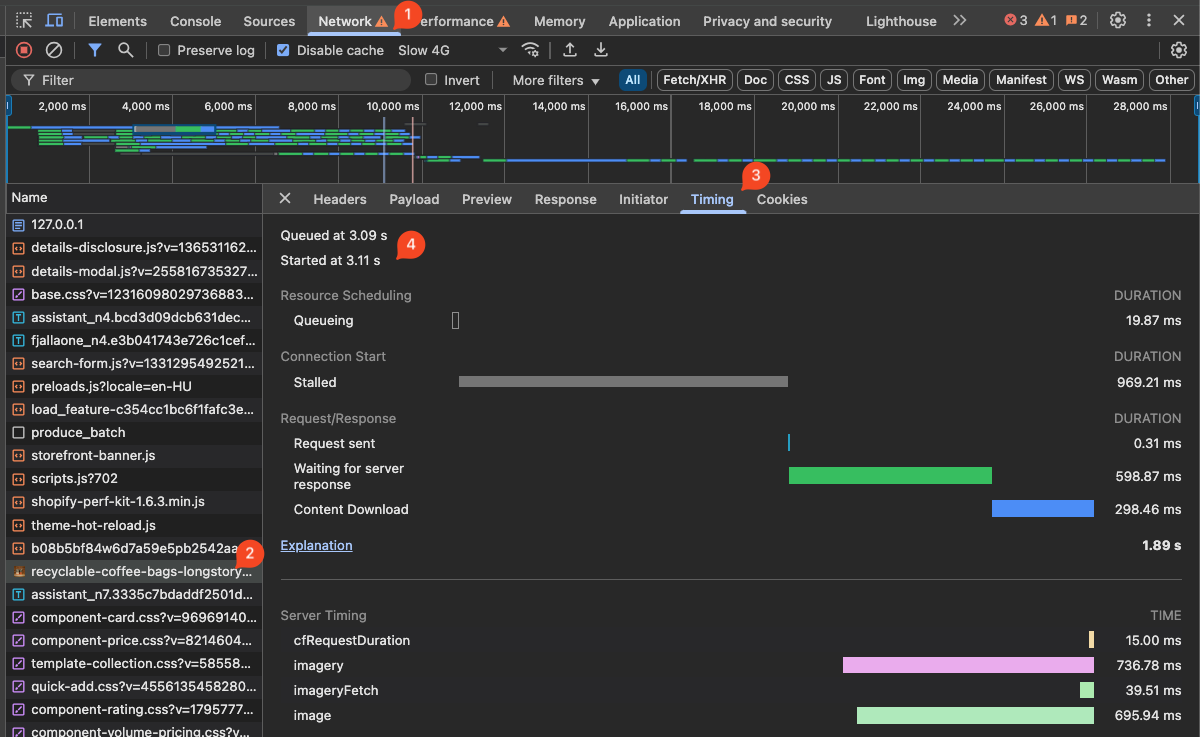
Our LCP image can have high-priority definitions, but if the browser discovers the element too late, it will start loading it too late. Go to Network, find your LCP resource request, then check Timing, Queued, and Started. If it gets queued for over 800ms, the browser learned about the resource way too late.
This might often be the case with Shopify themes, because your LCP image might be within a section (e.g.: Hero section) that gets loaded later than other resources.
Index.html <head> is the best for discoverability
Unfortunately, this is a common issue with Shopify themes, and it derives from the way Shopify themes are built (e.g.: Dawn). One workaround is to add your image setting on a global level (settings_schema.json). This way you can use the theme settings directly in your index.html header (theme.liquid). Putting your LCP resource element directly in your index.html <head> ensures that the browser discovers the element as soon as possible.
For example, if you are trying to display a product image in your hero section, you might add a product typed theme setting in your settings_scheme.json and use the setting in your index.html template (theme.liquid).
{
  "name": "Hero Settings",
  "settings": [
    {
      "type": "product",
      "id": "hero_product",
      "label": "Hero Product"
    }
  ]
},
Then reference it in your theme.liquid:
{% assign hero_product = all_products[settings.hero_product] %}
    {% if hero_product.featured_image %}
      <link
        rel="preload"
        as="image"
        href="{{ hero_product.featured_image | image_url: width: 300 }}"
        media="(max-width: 749px)"
        fetchpriority="high"
      >
      <link
        rel="preload"
        as="image"
        href="{{ hero_product.featured_image | image_url: width: 800 }}"
        media="(min-width: 750px)"
        fetchpriority="high"
      >
{% endif %}
This approach comes with a UI trade-off: the admin sets content in Theme Settings, not in the Hero section. In return, you can reference that content directly in the index.html header - the fastest way to start downloading it. Adding preload and fetchpriority also prioritizes it over other resources.
This approach needs extra validation. You probably don’t want to preload the same product image on every page - only where the hero section exists. Other pages may need different LCP images.
To learn more about optimizing load delay, refer to this article by Google.
Step 3: Reducing Render Delay
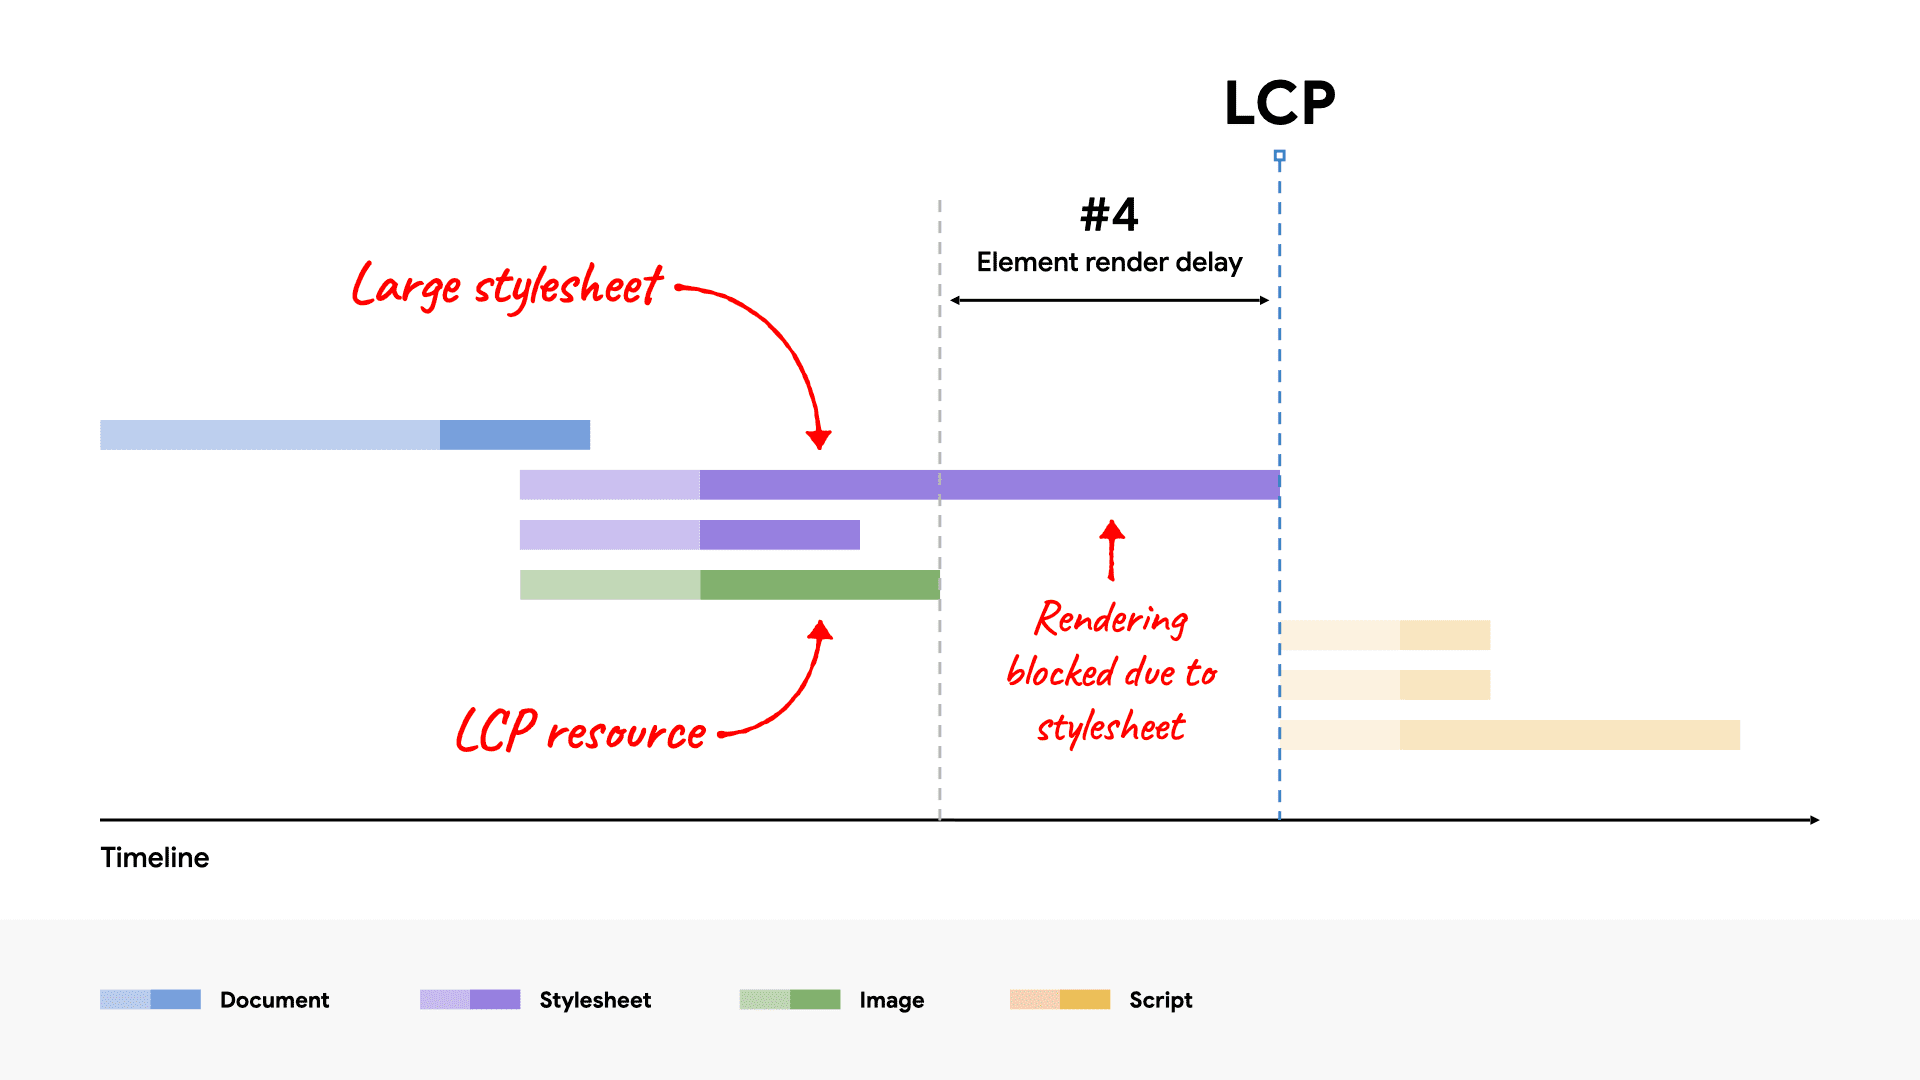
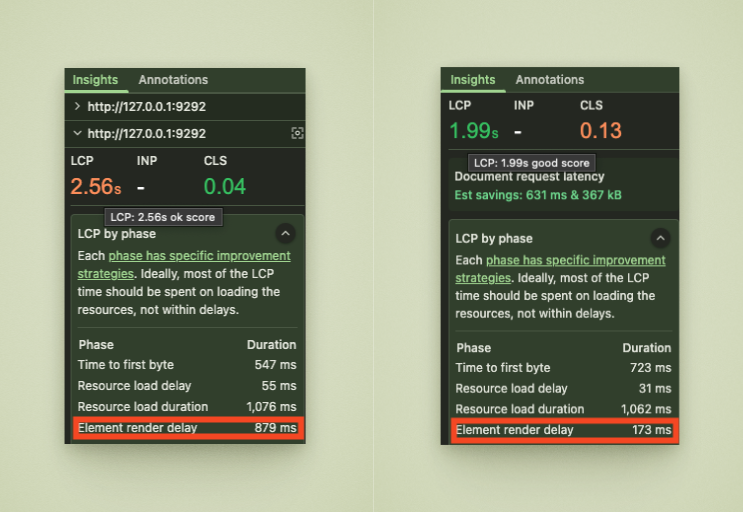
The second LCP phase we’ll improve is Element Render Time Delay (or simply Render Delay). This is the time between when your LCP resource is loaded and when it is rendered. Our goal is to let the LCP element render immediately after loading.
Usually this does not happen because other factors interfere. Common culprits:
- Stylesheets, synchronous scripts in the
<head> - LCP is loaded but not added to the document (because a JavaScript adds it dynamically)
- Other Long Tasks
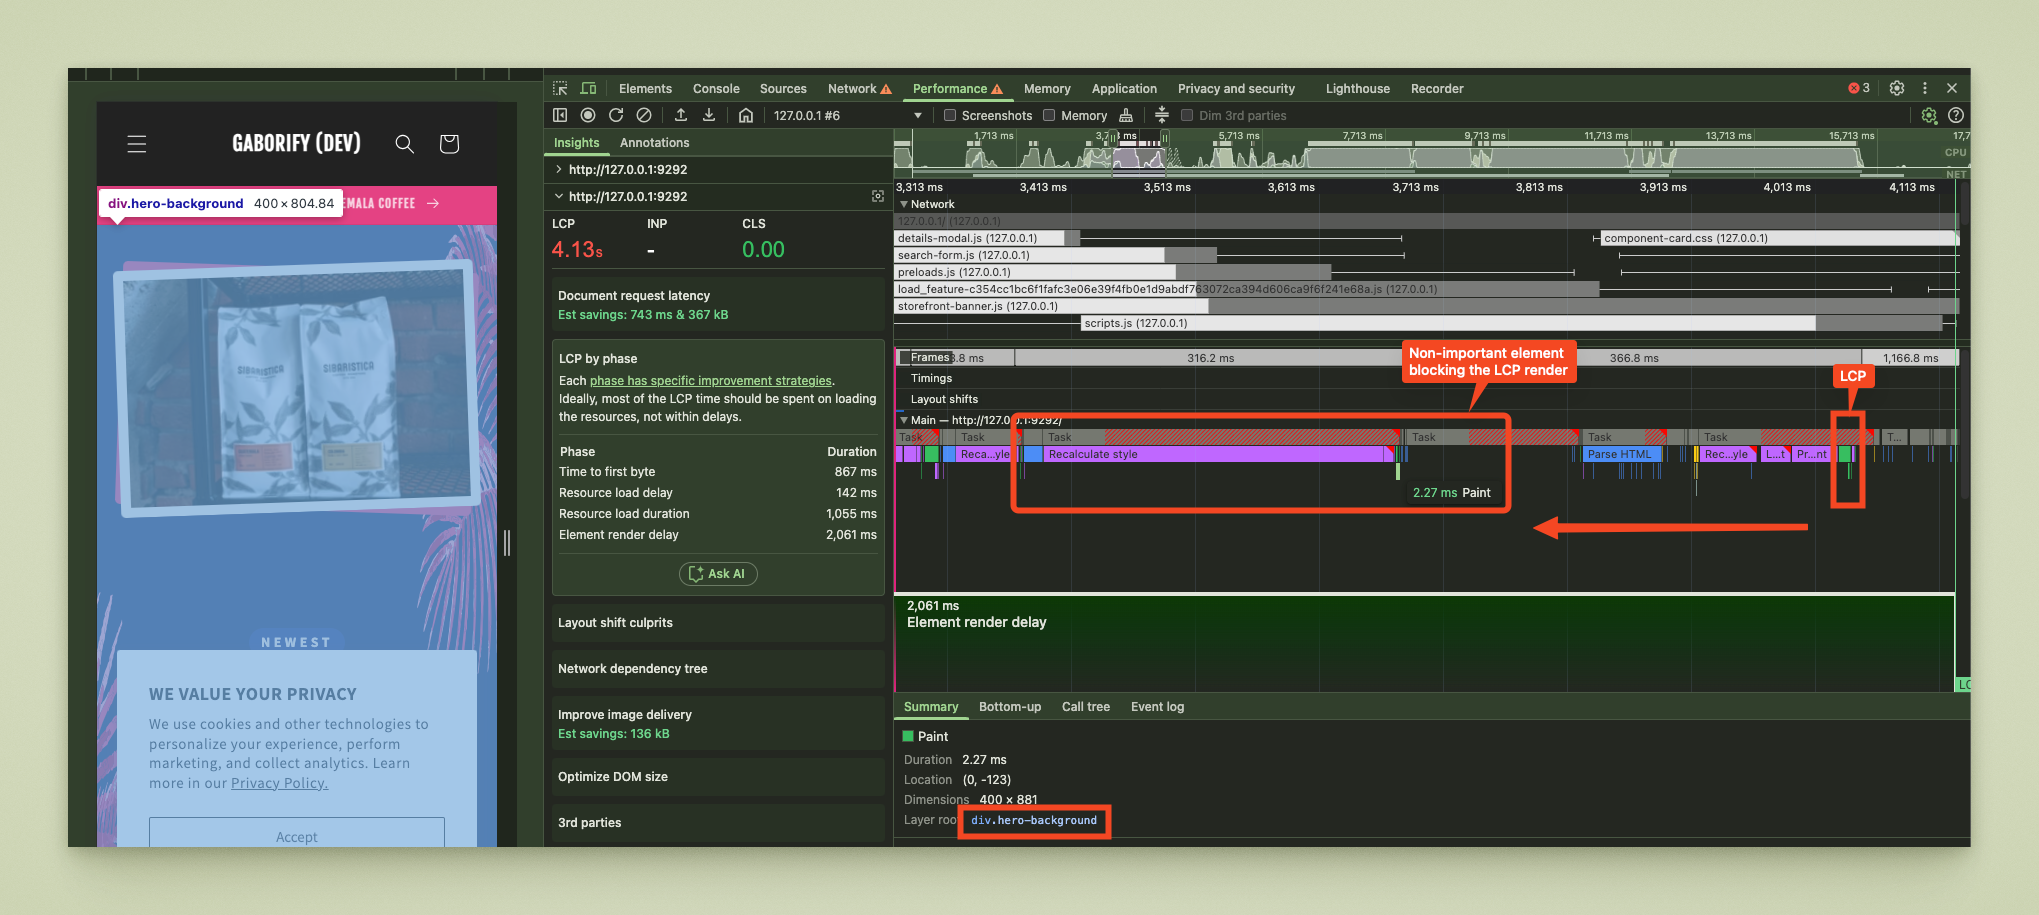
The first step is to identify what blocks render. In the Main Thread flamechart, find the Element Render Delay range, then locate the green Paint block with the Layer root of your LCP image. Everything before that, inside the same range, blocks render.
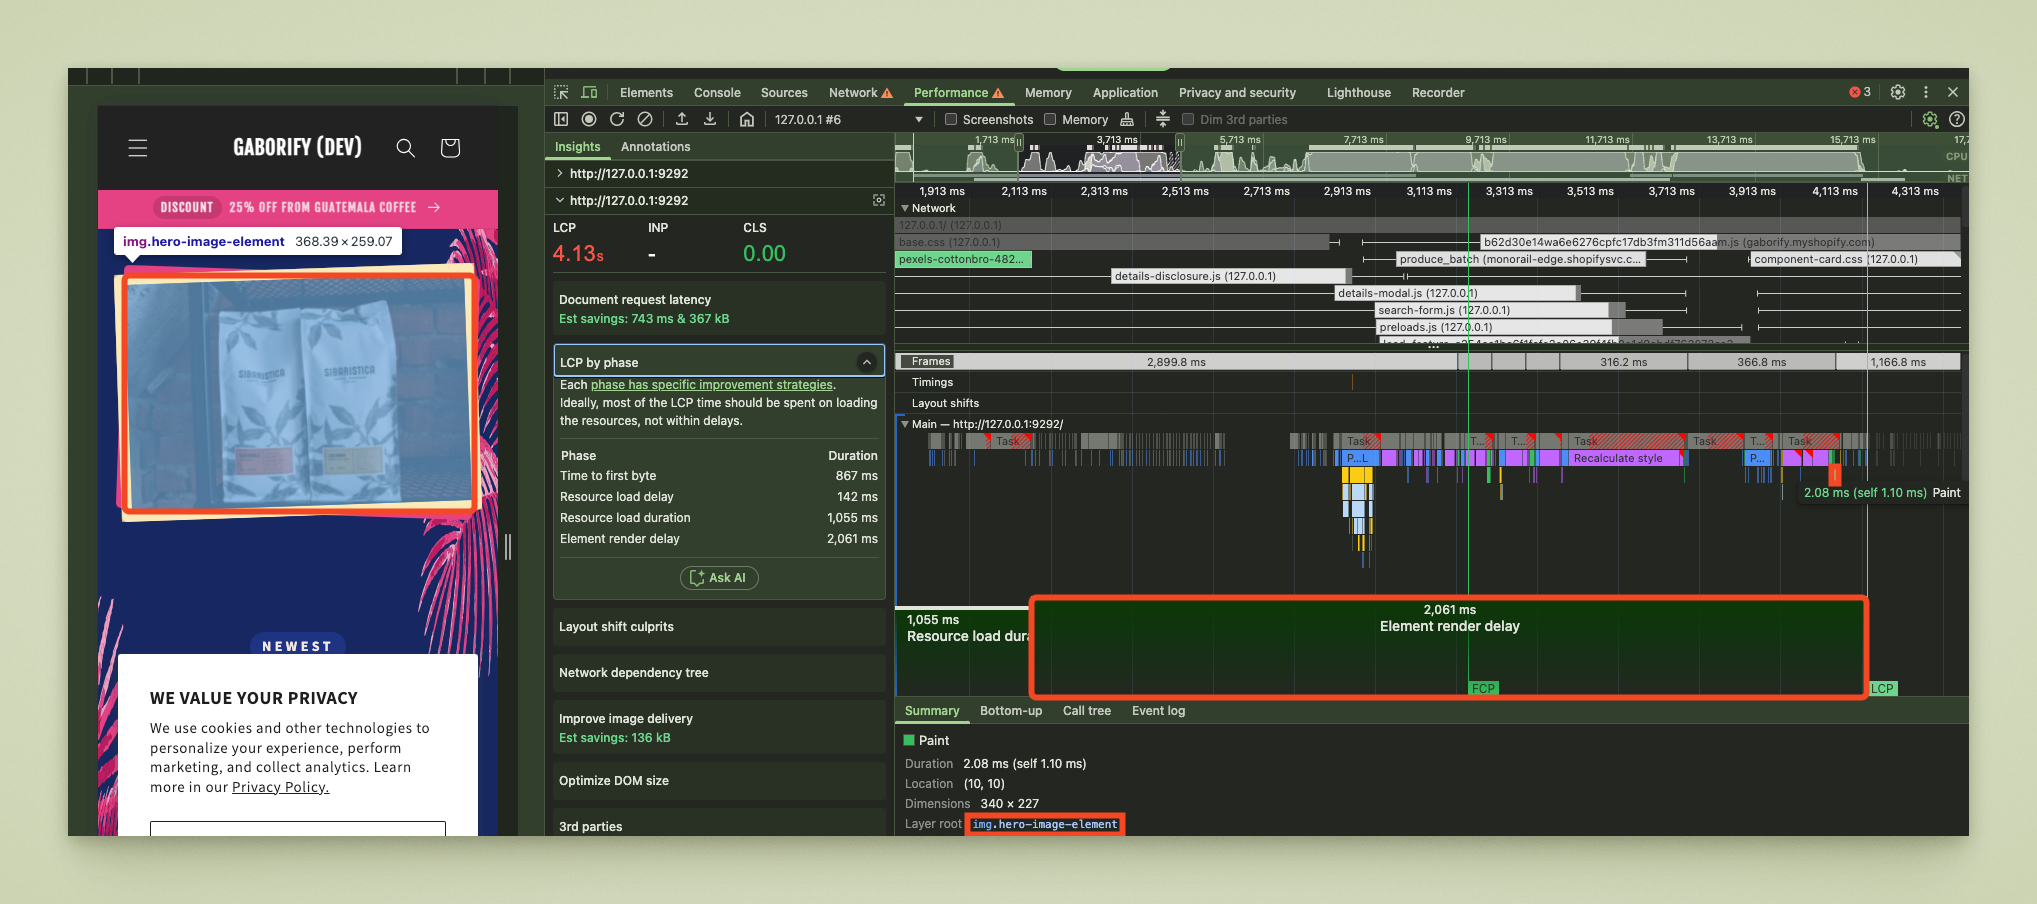
Once we know where LCP gets painted, we can inspect the blocking tasks. Go through tasks (red blocks) one by one, starting with the biggest.
Step 3.1: Fixing HTML element order
One of the causes of render delay is render prioritization. For example, while developing Coffee World, I noticed that drawing the background image of my hero section actually blocked the drawing of the LCP image.
The simplest technique is to bring up your preferred element in HTML. This might be the solution if both your elements are positioned absolute and/or if both elements are in the same section.
<div class="relative-hero">
  <!-- LCP element first -->
  <img class="absolute-lcp-first" src="..." />

  <!-- Background element second -->
  <div class="absolute-background-second"></div>
</div>
HTML element order matters in render prioritization
3.2: Setting content visibility
If you are dealing with elements across multiple sections or not within the same parent, you can use CSS tricks to set prioritization. This might be the case, for example, if your navigation bar gets painted before your LCP image, which makes sense, because your navbar usually comes first in your HTML.
.navigation-header {
  content-visibility: auto;  /* Method A: most effective */
  contain-intrinsic-size: 100% 80px; /* Expected header height */
  z-index: 0; /* Method B: good fallback  */
}

.lcp-element {
  content-visibility: visible; /* Force immediate rendering */
  z-index: 1;
}
Use content-visibility CSS rule to prioritize render
In order for this to work, your CSS file containing these rules should be loaded and parsed as well.
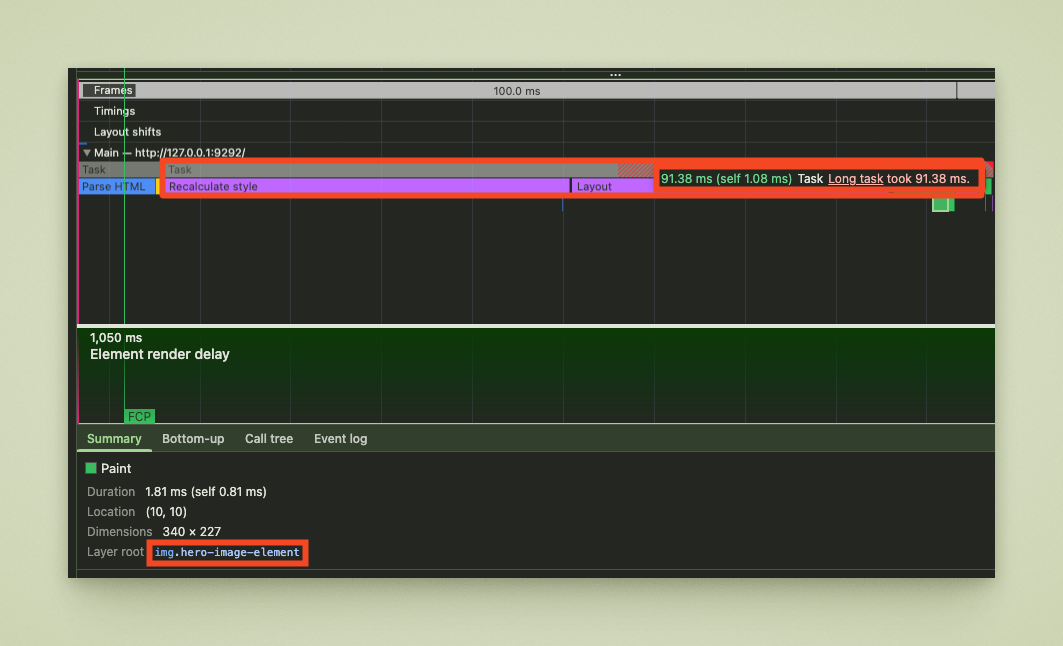
3.3: Speeding up Long Tasks
A task is considered a Long Task if it’s above 50ms according to Google. We can improve the speed of our task by shortening our “Recalculate style” and “Layout” blocks. In my case, simply rendering the LCP image was itself a Long Task.
Low coverage
The most common cause of expensive style recalculation is low CSS coverage. To see if you have low coverage, go to Chrome Dev Tools and open the Coverage tab.
Look at all the CSS rules my homepage does not use:
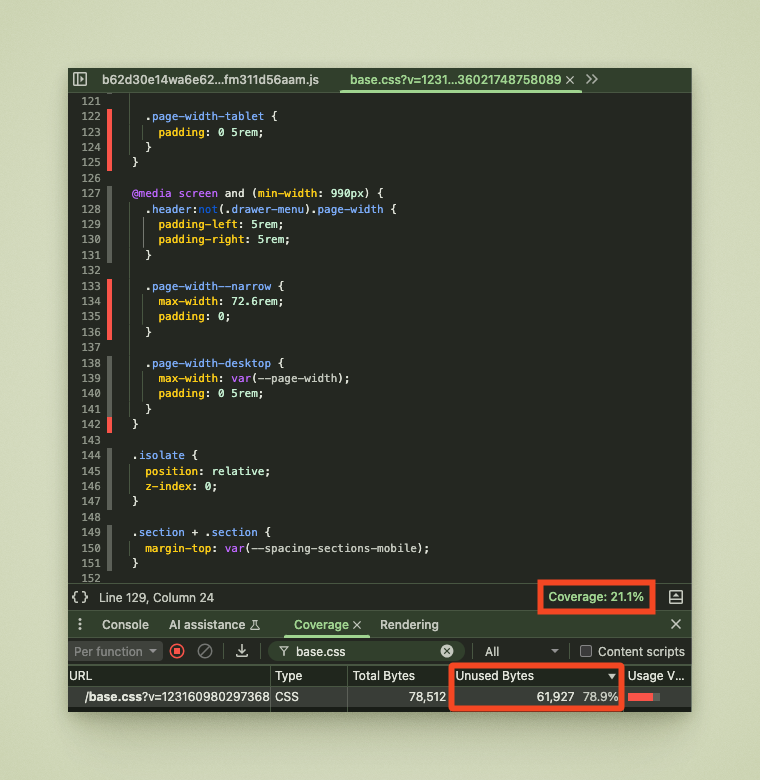
Shopify Dawn theme uses a huge base.css, which preloads a sea of CSS rules. This is because many section styles are dumped into this file, which is then evaluated on ALL pages, even when the section is not present. This is suboptimal: section-specific CSS rules should be moved to the relevant template files, and unused rules should be deleted.
Tip to test: To validate the impact of unused CSS, temporarily remove it with UnCSS Online! for a given HTML file and run the audit again. You’ll usually see a big LCP improvement. This is for problem validation only. A quick workaround is to load critical CSS on the homepage and full CSS on other pages.
{%- if request.page_type == 'index' -%}
      {{ 'base--home-critical.css' | asset_url | stylesheet_tag }}
    {%- else -%}
      {{ 'base.css' | asset_url | stylesheet_tag }}
{%- endif -%}
Separate base.css and base--critical.css for testing purposes.
CSS selector complexity
The second most common problem is too complex CSS selectors, which cause the browser to render slowly. Complex selectors must be updated to simpler, performance-light selectors. For example, instead of .hero:not(.active) -> hero--inactive.
| Selector Type | Example | Why It’s Expensive |
|---|---|---|
| Deep descendant selectors | .hero div ul li span | Browser must match deep trees |
| Universal selectors inside | .hero * | Matches all children |
| Attribute selectors | .hero input[type="text"] | Slower than class/id selectors |
| Complex combinators | .hero > .container + .title | Costly traversal logic |
| Negations or pseudo-classes | .hero:not(.active) | Adds complexity to evaluation |
/* Bad: Complex selectors cause slow recalculation */
.shopify-section .hero-wrapper .container .row .col .hero-image {
  /* styles */
}

/* Good: Simple, specific selectors */
.hero-image {
  /* styles */
}
Complex CSS selectors are expensive
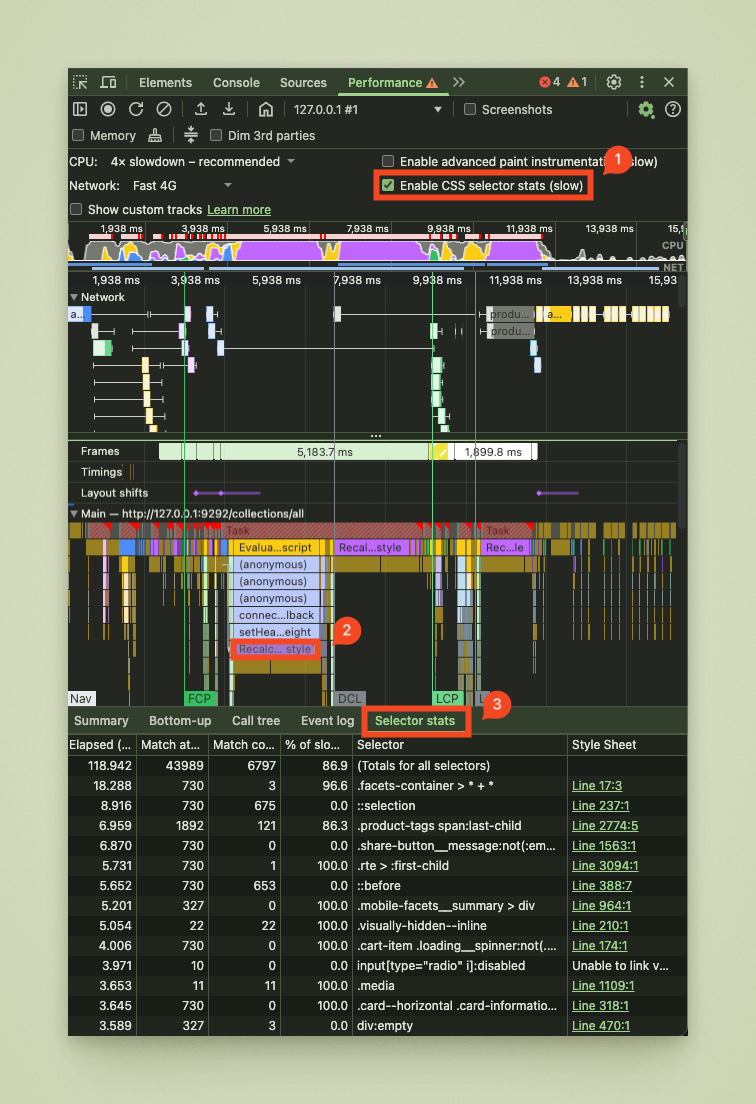
We can identify complex selectors using the Performance tab. Make sure Enable CSS selector stats is checked in Chrome Performance tab. Then identify your task, click on the purple “Recalculate style” block, then click “Selector stats” tab. Organise your selectors by Elapsed (ms), and voilá: here’s a list of your most performance-costly CSS selectors.
You can also audit selectors manually for a given section. Use the following snippet in your console to print all CSS selectors that are related to your inspected element (e.g.: .hero).
// Run in console to find expensive selectors
Array.from(document.styleSheets)
  .flatMap(sheet => Array.from(sheet.cssRules))
  .filter(rule => rule.selectorText && rule.selectorText.includes('.hero'))
  .forEach(rule => console.log(rule.selectorText));
Script to print CSS selectors for a given context
This will print out a list of CSS selectors used in your document. Look for performance-heavy selectors (see table above).
Other tips
If you want to dig deeper and reduce Render Delay even further, here are some tips on how to fine-tune your CSS:
Improving for Style recalculation by using CSS containment
Use the contain CSS rule to improve Style recalculation.
.hero-section {
  contain: style layout; /* Isolate style calculations */
}

.hero-image {
  contain: layout style paint;
}
Improving for Style recalculation by minimizing CSS rules
Fewer CSS rules result in faster document parsing and rendering.
/* Bad: Too many properties trigger recalculation */
.hero-image {
  position: relative;
  transform: translateX(0) translateY(0) scale(1) rotate(0deg);
  filter: brightness(1) contrast(1) saturate(1);
  box-shadow: 0 0 0 rgba(0,0,0,0);
  /* ... 20+ more properties */
}

/* Good: Only essential properties */
.hero-image {
  display: block;
  width: 100%;
  height: auto;
}
Improving Layout speed by simplifying DOM structure
Simpler HTML structure results in faster document read and render.
<!-- Bad: Deep nesting causes slow layout -->
<div class="hero-section">
  <div class="container">
    <div class="row">
      <div class="col-12">
        <div class="hero-wrapper">
          <div class="image-container">
            <img class="hero-image" />
          </div>
        </div>
      </div>
    </div>
  </div>
</div>

<!-- Good: Flat structure -->
<section class="hero-section">
  <img class="hero-image" />
</section>
Improving Layout speed by using modern CSS layout
Grid and flexbox are faster than old float positioning.
/* Replace complex float/positioning with modern CSS */
.hero-section {
  display: grid;
  place-items: center; /* Instead of complex centering */
}

/* Or use flexbox */
.hero-section {
  display: flex;
  align-items: center;
  justify-content: center;
}
Improving Layout speed by avoiding layout-triggering properties
Remove layout triggering properties to improve Layout speed.
/* Bad: Forces layout recalculation */
.hero-image {
  width: calc(100vw - 40px);
  height: calc(100vh - 100px);
  margin-left: calc(50% - 200px);
}

/* Good: Static dimensions */
.hero-image {
  width: 100%;
  max-width: 800px;
  height: auto;
}
Improving Layout speed by using transform
Transform is faster than layout properties.
/* Bad: Triggers layout */
.hero-image {
  margin-left: 50px;
  top: 100px;
}

/* Good: Uses composite layer */
.hero-image {
  transform: translateX(50px) translateY(100px);
}
Step 4: Reducing Server-Side Render Delay
Shopify’s Liquid templates are compiled and rendered server-side before the resulting HTML is sent to the user’s browser. This means that by writing better Liquid syntax we can reduce the time the server needs to render our HTML.
In order to keep this article concise, I will not explain this in detail, but as a general rule here are some guidelines:
- Avoid deep nesting of
{% for %}loops. - Use
{% unless %}and{% else %}wisely to avoid unnecessary checks - Cache large data sets (use pagination or limit filters)
- Reuse computed variables instead of repeating expensive filters
- Minimize use of
all_productswhere possible (limited and performance-heavy)
Step 5: High-level summary
To recap, here’s the high-level summary:
- Web performance increases UX and SEO
- To improve web performance, we can rely on Core Web Vitals
- LCP: largest visible content element in the viewport during page load
- LCP has 4 parts, but we should focus on Load Delay & Render Delay
- To improve Load Delay, make sure our element:
- is discoverable (e.g.: preloaded in
<head>) - has high priority (
fetchpriority="high"andrel="preload")
- is discoverable (e.g.: preloaded in
- To improve Render Delay:
- make sure our element is placed before other elements in HTML
- remove unused CSS
- reduce CSS complexity by replacing performance-heavy selectors with simple ones
- use performance-light CSS rules
- defer non-critical CSS and JS
- Improve server-side render delay for Shopify by writing better Liquid
I hope you picked up something new reading this article. Remember: fast performance means better UX — and better UX means more trust, happier users, and better conversions.